L2 100 Social Media Performance
2012
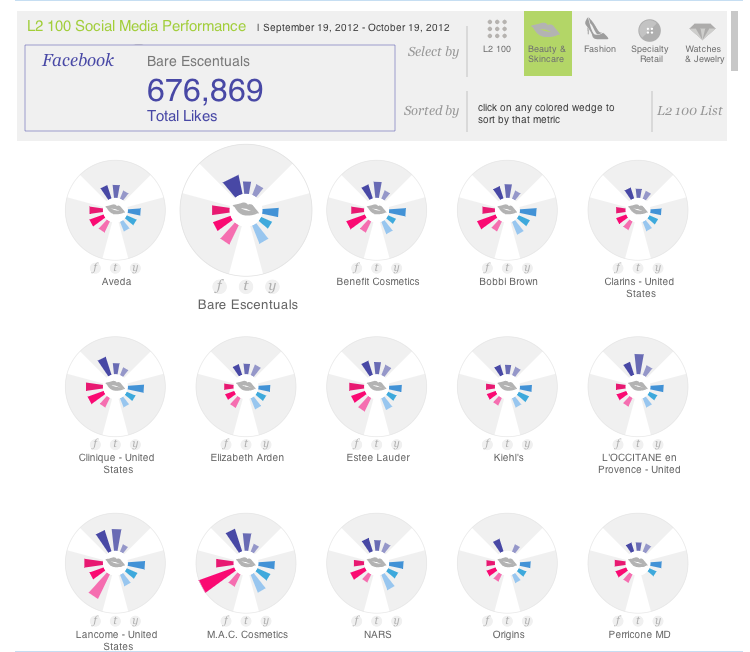
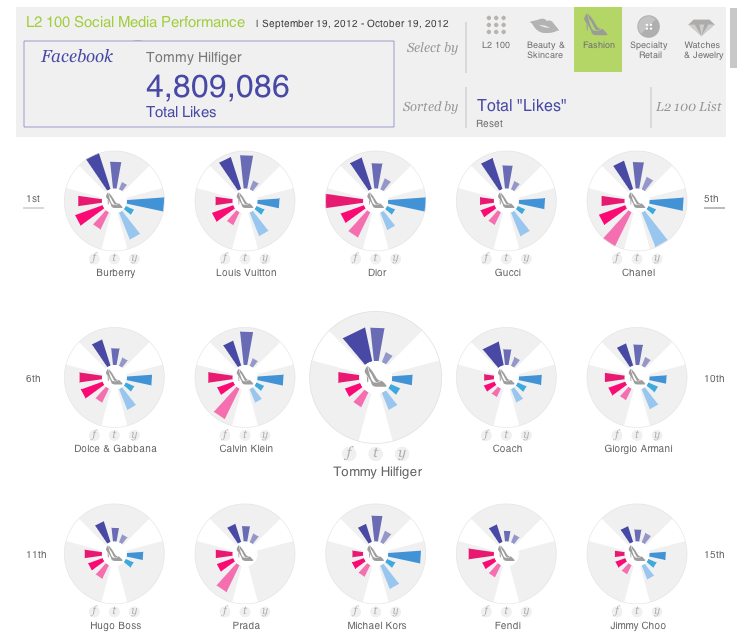
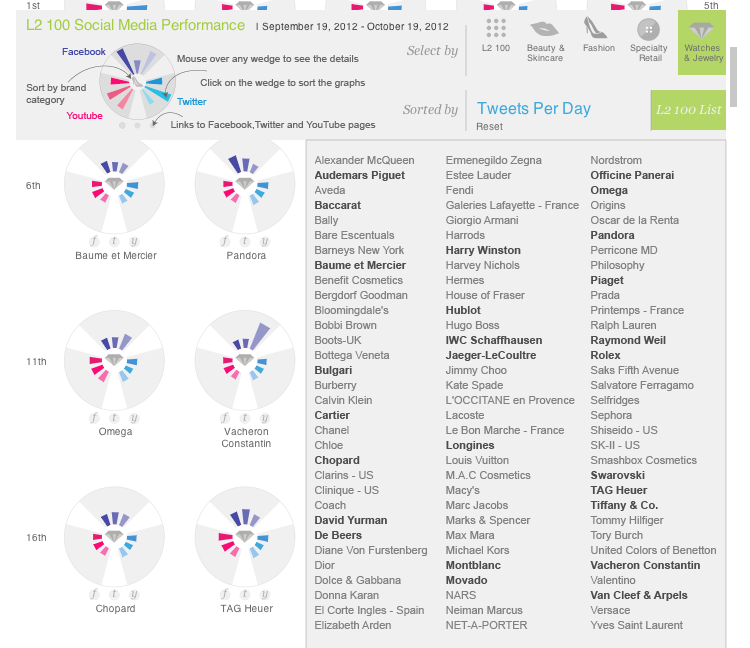
This project was a consultancy I did for L2, a think tank for digital innovation based in New York. It features an interactive visualization of the social performance of 100 iconic prestige brands in real time. Each circle represents a brand’s performance. Hovering over any wedge in the circle reveals the associated data. The blue wedges represent Facebook performance, including likes, likes per day, and engagement. The teal wedges represent Twitter followers, tweets per day, and followers per day. The red wedges represent YouTube views per day, number of subscribers, and total video views. Clicking on any wedge sorts the brands by that metric. You can also sort the brands by category: Beauty and Skincare, Fashion, Specialty Retail, and Watches & Jewelry. The small circles below the brand pies link to the corresponding Facebook, Twitter, and YouTube pages.